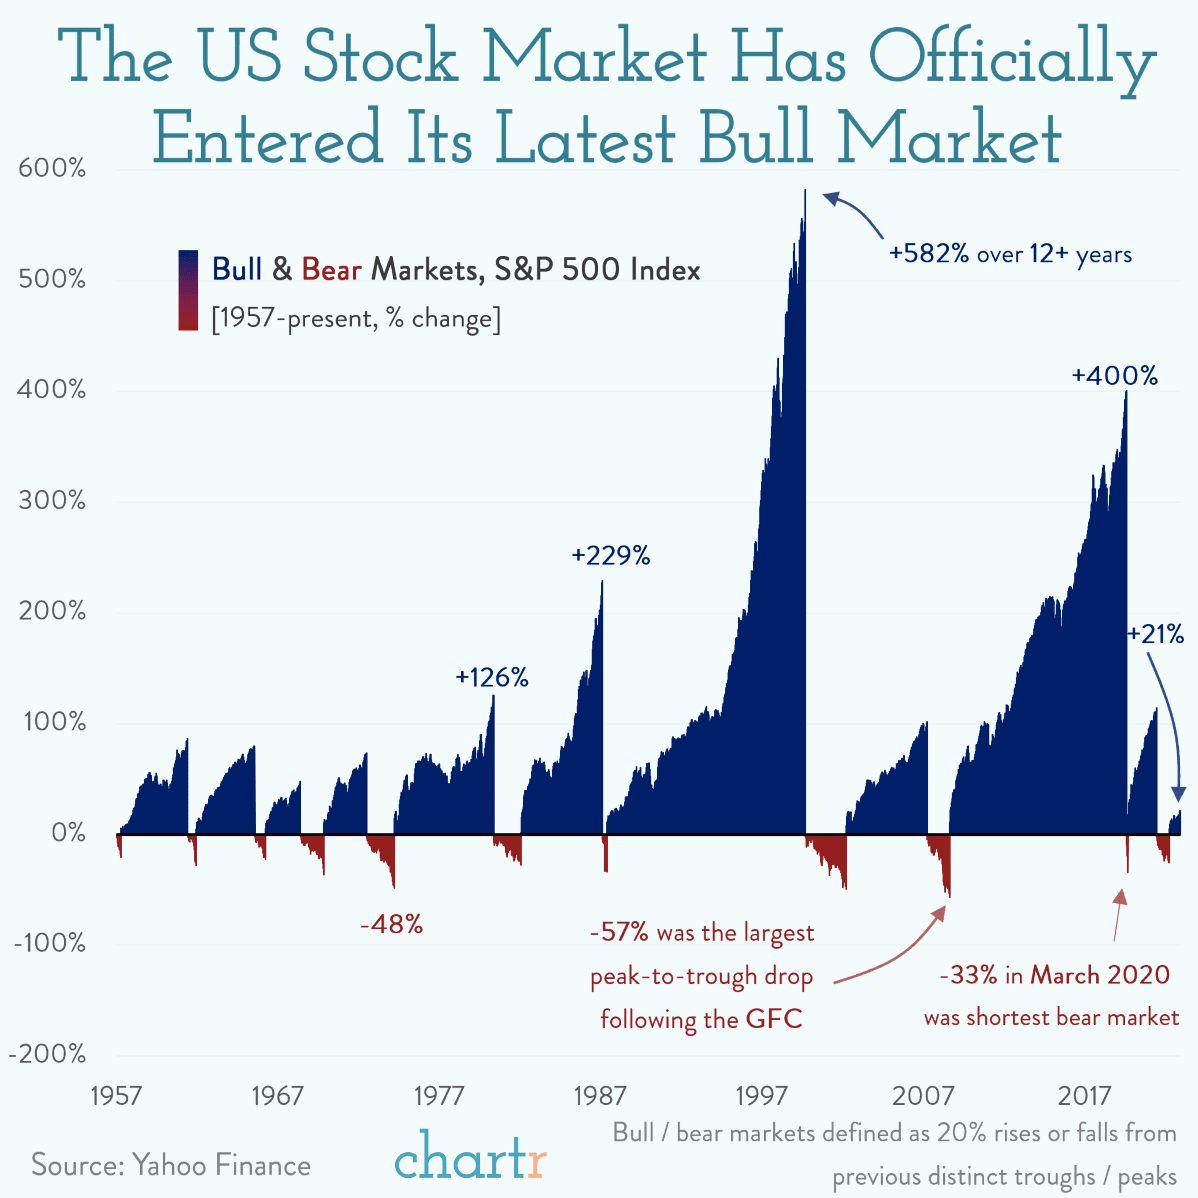
Bearly noticed: Visualizing 60+ years of bull and bear markets

Bearly noticeable
The S&P 500 has surged 25%* since its October low, surpassing the 20% that many hold as an unofficial threshold for entering a bull market.
As we’ve noted recently, investors often have to climb a “wall of worry” in order to get comfortable investing in stocks — and this year’s list of concerns was long. However, the economy has been surprisingly resilient. Inflation has receded from its summer peak, job reports have been consistently solid and the debt ceiling showdown has been (mostly) resolved.
Back to the future
The tech giants have driven a large portion of this rally, thanks in part to the current buzz around AI. Nvidia, a semiconductor powerhouse seen as integral to AI’s ongoing development, has seen its shares surge 187% this year, catapulting the company into the $1 trillion club. The whole S&P 500 may have gained 11% so far this year, but the average individual stock has risen less than 3% in 2023. Indeed, some 90% of the index’s rise is down to just 7 companies; Amazon, Apple, Meta, Microsoft, Nvidia, Tesla, and Alphabet.
Obviously no one knows how long this run will go on, but historically bull markets have typically lasted nearly 5 years (since 1932), resulting in an average gain of 178% for the S&P 500. The previous bull market, which commenced in March 2009, persevered for an astonishing 11 years, ended only by the pandemic. In contrast, the most recent bear market was relatively tame, lasting only 9 months with a decline of 25%, less severe than the average decline of 34%.
* As of 7/13/2023
